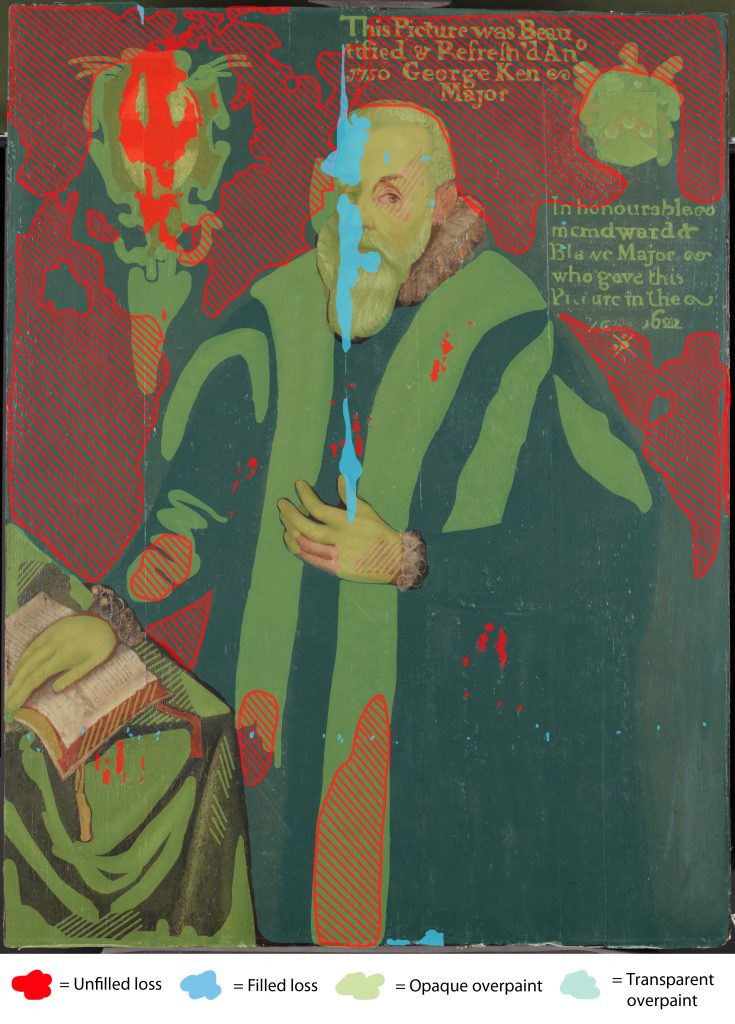
Figure 2: This diagram was made using the infra-red reflectograph, UV and X-radiograph of the painting, as well as looking through the microscope at the surface of the painting. The background has been extensively damaged in the past and there are both filled and unfilled losses in the paint layers, suggesting several different campaigns of restoration in its history. Finally, the green and turquoise areas show where the damages have been covered with restoration, which covers most of the painting (©Bayliss/Courtesy of the Charterhouse, London)